
Deflation
SUBTRACTING ENERGY AND LABOR COSTS FROM WEALTH CREATION…:
Soon, there will be so much electricity you might be paid to use it (Amin Al-Habaibeh, July 21, 2026, The Conversation)
Imagine a perfect summer weekend day: a cloudless blue sky with a gentle breeze. Solar panels are at full capacity, wind turbines are turning offshore – and many people are out and about, in gardens or parks. Electricity supply is high, but demand is low.
Electricity systems must balance supply and demand in real time. In the above scenario, when renewables are producing lots of electricity but there isn’t much demand, energy companies may need to curtail output – disconnecting their turbines or panels from the grid, and essentially wasting clean energy that could have been generated. Hours later, when demand rises, that energy is no longer available.
In the UK, wind farms are already being paid to switch off on days when supply outstrips demand.
…is unimaginably deflationary.
NO ONE HAS IT HARDER THAN THEIR FATHER DID:
Capitalism Gets a Bum Rap (Emma Camp, July 13, 2026, WSJ: Free Expression)
Recently a video went viral showing the inside of a 1958 GE refrigerator. The appliance restorer behind the camera starts the video by declaring that “they don’t build things like they used to.” He then shows off some unusual features, like rotating shelves. Just about all the commenters seemed to think the reason modern refrigerators aren’t as nice as the one in the video is, you guessed it, capitalism.
“They made everything worse while making everything more expensive,” reads one comment with more than 46,000 likes. Another comment with thousands of likes declared that “capitalism is literally built on the premise that things are not reliable.”
This couldn’t be more wrong. This particular fridge was almost certainly far more expensive than a comparable appliance today. While I couldn’t track down the price for that exact model, I did find an ad for a similar-looking refrigerator in a 1958 Sears catalog. That refrigerator is listed at $399.95, around $4,600 today. A quick internet search reveals that most refrigerators today are much less expensive than that. When Wirecutter, a product-review website, made a list of the best refrigerators on the market earlier this year, only one of them came within $1,000 of the 1958 refrigerator’s price tag.
If you’re looking to drop $4,600 on a fridge for some reason, you’ll end up buying a luxury product. A similarly priced smart fridge is nearly 10 cubic feet larger than the 1958 one. It has a built-in ice maker (including a setting for making clear cocktail spheres), a special viewing window and a drawer with a “chilled wine” setting.
If that doesn’t convince you that appliances today are better than their midcentury counterparts, modern refrigerators are also much more energy efficient. And contrary to complaints that modern appliances are built to break, the longevity of our refrigerators has barely budged in 30 years. In 1990, 38.2% of family refrigerators were more than 10 years old. In 2020, it was 35.1%.
…AND CHEAPER…:
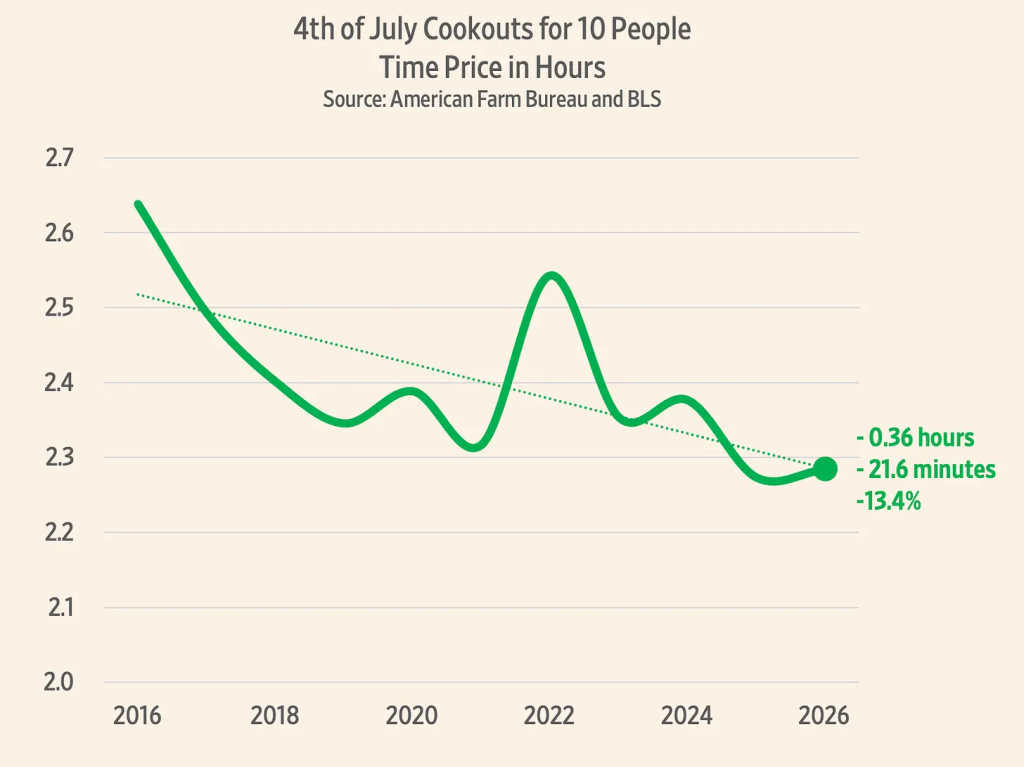
Time Pricing the Fourth of July Cookout: Independence and abundance. (Gale Pooley, Jul 04, 2026, Human Progress)
IT’S IMPOSSIBLE TO OVERSTATE DEFLATIONARY PRESSURES:
How Volkswagen ended up with a huge workforce (Nik Martin, 7/07/26, Deutsche-Welle)
At nearly 630,000 people — 680,000 if you count joint ventures in China — VW employs around 60% more workers than Toyota, 140% more than Stellantis and nearly 240% more than Ford.
That headcount was once a sign of Germany’s industrial might and VW’s huge profits. Now, it’s become a massive burden, one that’s forcing the company to make painful job cuts to survive against agile Chinese competitors.
…AND CHEAPER…:
Homes Today Vs. 1956 – What’s The Difference? (NICOLE MURRAY, 4/14/26, The Mortgage Note)
To start, American homes today are larger. Jeremy Horpedahl, an associate professor of economics at the University of Central Arkansas, recently told The Mortgage Note that new single-family homes are twice as big in terms of square footage compared to 1956.
“Believe it or not, it costs roughly the same per square foot,” Horpedahl said.
Beyond that, Horpedahl says it’s all about the amenities. For example, in 1956, only 50% of new homes were equipped with a garage. In 2024, 96% were. The percentage of homes with central air systems and appliances has dramatically increased as well.
Contra the Left/Right, our affluence is staggering.
…AND CHEAPER…:
Economists Once Dismissed the A.I. Job Threat, but Not Anymore (Ben Casselman, April 3, 2026, NY Times)
In a working paper published this week, a team of researchers surveyed economists about their outlook over the next five and 25 years. Most expect the economy to grow a bit more quickly as A.I. improves, but not to diverge substantially from historical patterns. If the technology improves rapidly — a possibility they consider unlikely but plausible — they envision a far more drastic scenario with faster growth but also greater inequality and the disappearance of millions of jobs.
“Economists are certainly taking A.I. seriously,” said Ezra Karger, an economist at the Federal Reserve Bank of Chicago who was one of the study’s authors.
IT’S IMPOSSIBLE TO OVERSTATE DEFLATIONARY PRESSURES:
Corporate Adviser Says the Ideal Number of Human Employees at a Company Is Zero (Joe Wilkins, Mar 8, 2026, futurism)
That, at least, seems to be the contention of Daniel Miessler, an outspoken cybersecurity engineer and AI booster. In a rambling post on his personal blog, Miessler takes the position that human workers are already obsolete, so the best thing we can do is accept it and fall in line with the AI revolution.
“My favorite way of capturing this: the ideal number of human employees inside of any company is zero,” he wrote. “That is the number that they’re trying to get to.”
He’s not just using hyperbole, he takes pains to clarify.
“When I say zero, I mean zero workers,” the AI wonk told Fortune in a followup interview. “As in factory [or] machine jobs. Like regular working people.”
…coupled with renewable energy.
…AND RICHER…:
Are Americans Getting Richer? (Washington Post Editorial Board, Feb 20, 2026)
The premise of the index is simple: how many hours do you need to work, compared to the month or year before, to be able to afford the “basket of goods,” which is a standard set of household items and services that comprise the Consumer Price Index used to calculate inflation.
The “time price” is how many hours of work it takes to purchase the basket of goods. The “abundance” is how much of the basket one hour of work can buy. The story told by the index is a very good one: since recordkeeping began, “abundance” for average private sector workers comes out to a net increase of 13.8 percent.
…AND CHEAPER…:
Your Fridge Is Bigger and Cheaper Today, Thanks to Global Trade and Innovation (Jeremy Horpedahl, 11/26/25, Cato)
In 1984, the average hourly earnings for production and nonsupervisory workers (representing about 80 percent of the private workforce) stood at roughly $8.32. Acquiring the Kenmore would thus require approximately 163 hours of labor, equivalent to more than three full workweeks.
By contrast, a comparable 2024 model from a major retailer like Home Depot—matching size and features—retailed for $998 in nominal terms in 2024, when I last checked it, a direct reduction without inflation adjustment. With average hourly earnings in 2024 at about $29.85 for the same worker category, the labor investment drops to around 33 hours. In relative terms, refrigerators have become nearly five times more affordable, reflecting efficiencies from global supply chains, automation, and competition.
Interestingly, that fridge has increased in price sharply since 2024, almost certainly in part because of trade policy, and is currently listed at $1,658—even so, it is still much cheaper when measured in time prices, requiring just 53 hours of labor, compared with 163 hours in 1984 (and you can probably find a Black Friday deal on it too).